Google first started incorporating site speed into its rankings back in 2010.
A fast website isn’t enough to rank well, but poor performance can hurt your rankings.
We’ll take a look at some upcoming changes to how Google measures site speed, how to check if speed is an issue for your site, and discuss the most common web performance problems.
Core Web Vitals
In May 2020 Google announced that they’ll start using a new set of metrics to evaluate page performance: Core Web Vitals.
Core Web Vitals are a set of three metrics that describe how fast a page loads.
Largest Contentful Paint (LCP)
This metric measures how long it takes for the content of your page to render after a user navigates to your page. It should be under 2.5s.
First Input Delay (FID)
First Input Delay measures how responsive your site is to user input. When a user interacts with your page – for example by clicking a button – it should take less than 100ms to get a response.
The First Input Delay can only be measured if the user interacts with your page at some point. As that’s not always the case, Total Blocking Time is sometimes used as an alternative metric.
Cumulative Layout Shift (CLS)
This metric measures whether content moves around on the page after being rendered. For example, an ad at the top of your page that loads 1s after the main content might push down other page content when it loads. A CLS value below 0.1 is considered good.
Rollout
This ranking change won’t be rolled out before 2021, but you can expect these metrics to broadly correlate with the current site speed metrics used by Google. Largest Contentful Paint is closest to traditional load time metrics, while First Input Delay and Cumulative Layout Shift are more modern metrics focussed on user experience.
I've written a more in-depth guide to the different Core Web Vitals metrics here.
Core Web Vitals in Google Search Console
Google has added a new section for Core Web Vitals to the Search Console, allowing website owners to check if their site is having performance problems.
This data is collected from real users as part of the Chrome User Experience Report, so you might not be able to see data here if you have a new site with little traffic.
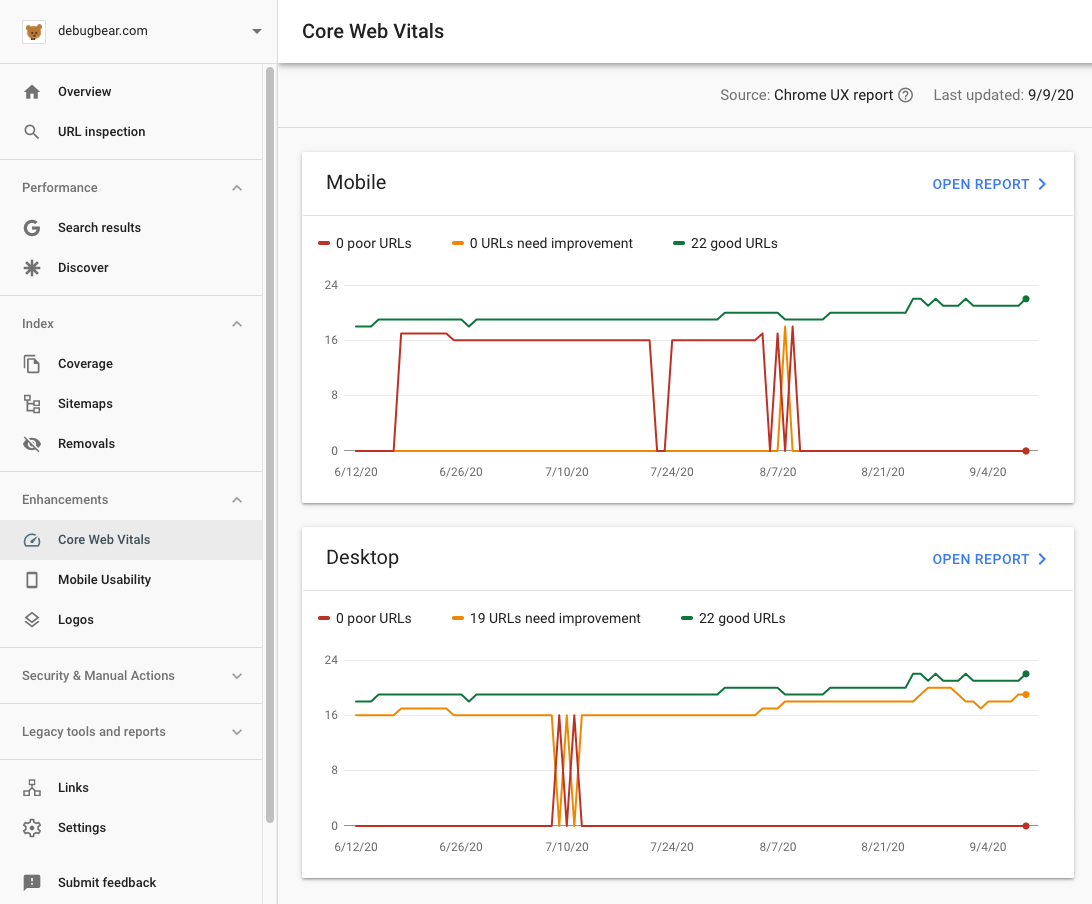
This screenshot shows that some pages on the Desktop site “need improvement”. We can click Open Report to see which of the Core Web Vitals needs to be improved.
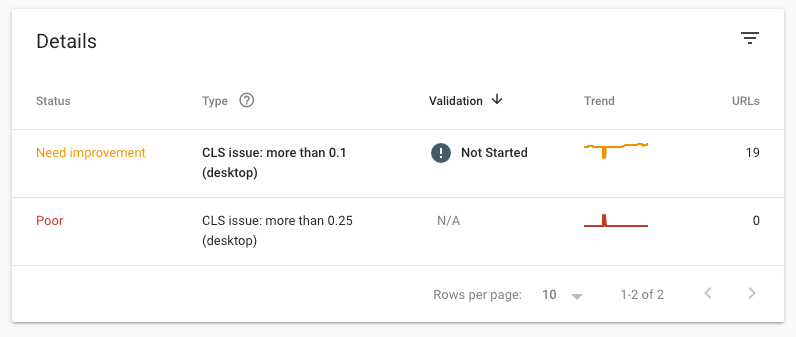
In this case the metric is Cumulative Layout Shift (CLS), meaning the page content moves around after it’s rendered.
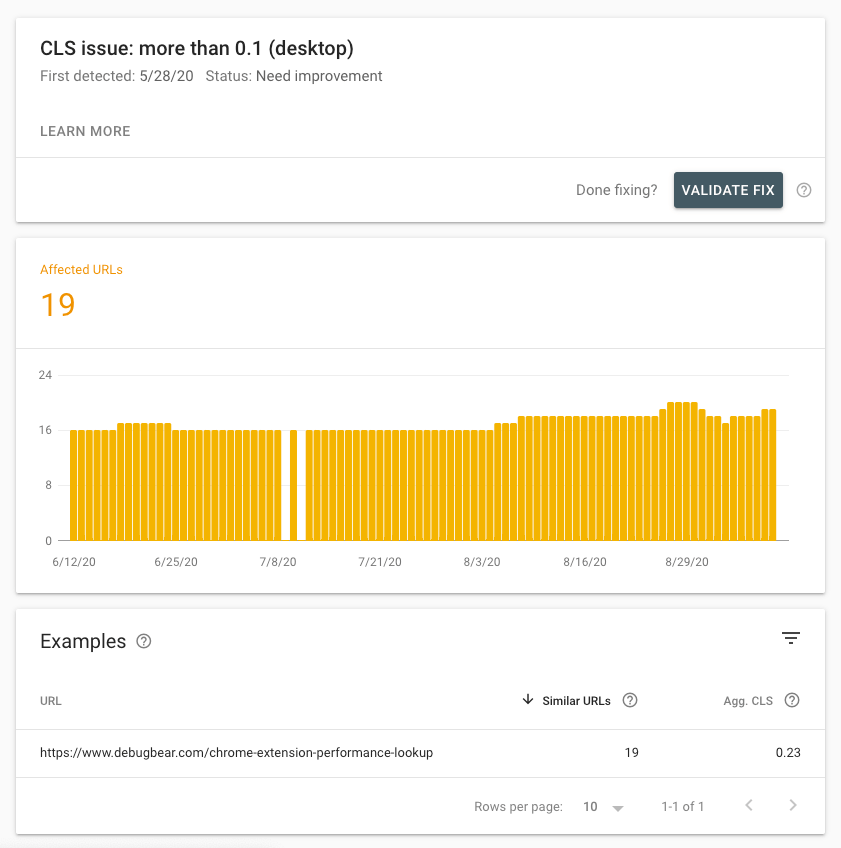
We can then click on the issue to dig deeper and find out what URL it occurs on.
Testing site performance with PageSpeed Insights
Now that we know what URL has a problem, how can we identify the cause and fix it? Google’s PageSpeed Insights tool can test a URL and provide a detailed evaluation of its performance, along with recommendations on how to improve it.
Below you can see an example report showing results for the global BBC homepage:
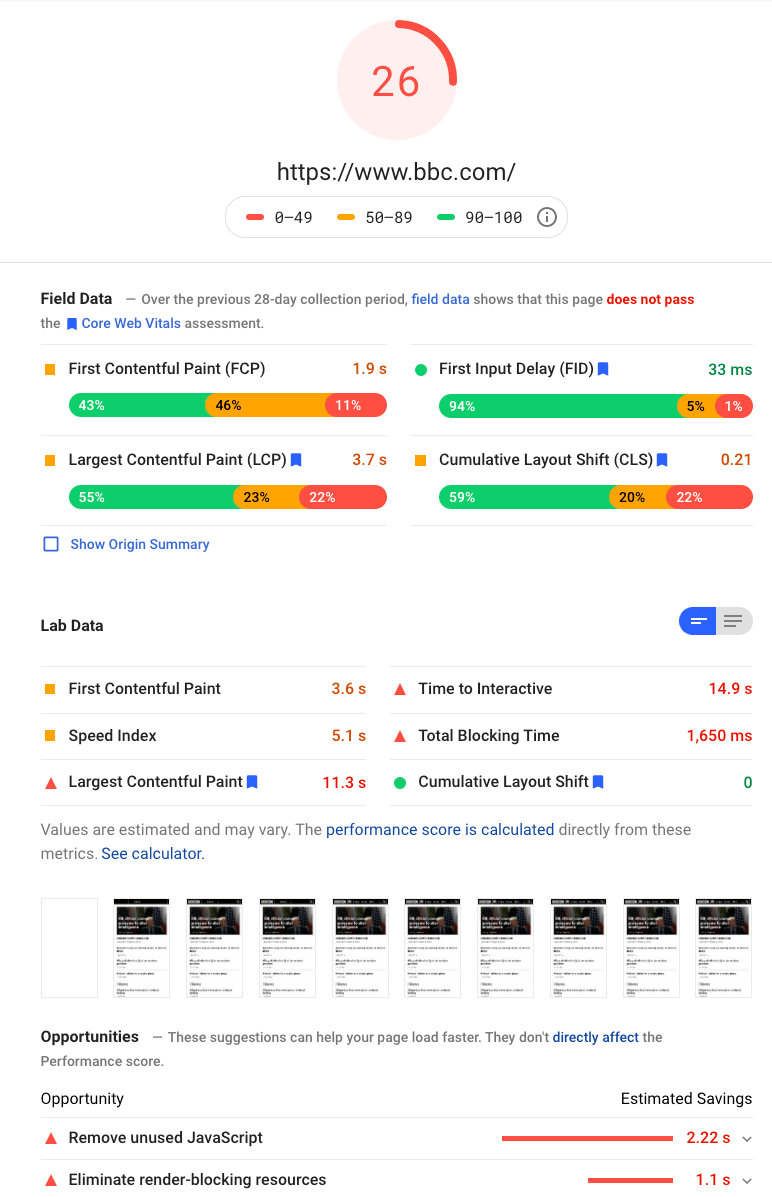
The PageSpeed Insights report can be a bit overwhelming when you first look at it. It consists of two parts: field data and lab data.
Field Data
Field data is collected when real users load your site in Chrome. If you put a URL with a lot of traffic into PageSpeed Insights you’ll get performance metrics specific to that page. Otherwise PageSpeed Insights will show you an aggregate view for your whole domain.
For the website in the screenshot, Google says it “does not pass the Core Web Vitals assessment”, suggesting poor site performance is hurting its search rankings.
Lab data
While field data is collected from real users, lab data is collected in a standardized environment. It simulates fixed network and CPU speeds, meaning results are easily comparable against each other. You can also run tests whenever you need, rather than waiting for real-user data to come in.
The lab-based metrics often look worse than the field data. The report above shows a lab-based LCP of 11.3s, while for real users it’s just 11.3s. That’s because PageSpeed Insights simulates a particularly slow device in the lab test. Real-users tend to be on faster devices with better network connections.
Monitoring lab data
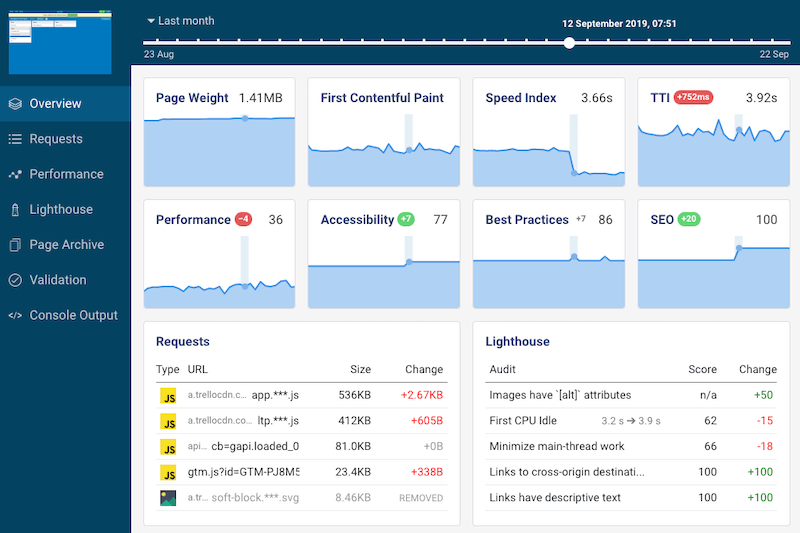
Google Search Console tracks real-user metrics, but this data won’t be available for all pages. PageSpeed Insights allows you to run one-off performance tests, but won’t alert you when a new issue is introduced.
That’s why I’m building a website monitoring tool that regularly tests your site performance and notifies you when there’s a regression.
Under the hood it uses the same technology as PageSpeed Insights, but you can configure tests to more closely match the experience of real users. It also keeps track of the SEO score you get from tools like Lighthouse and web.dev.
Common web performance issues
Let’s look at three extremely common site performance issues and how to fix them.
Slow server responses
Browsers can’t start rendering your page until your server has sent them a response to the initial page HTML request. This makes the response time for this request especially important.
Content Management Systems often render the entire page on the server, and as your site becomes larger and more complex this can start to cause problems.
Whenever possible, make sure that your CMS caches responses. That way, after the first request for a page, the server can just return the cached response without having to render it again.
Consider site performance when configuring your site. Adding a new plugin might be easy, but if it loads and processes a lot of data this can slow down your site. After making a change, run a test in PageSpeed Insights to see if the score has gone down.
Third-party scripts
Installing new third-party services for analytics, A/B testing, or a chat widget is easy: just add a script tag to your page.
But what’s not obvious is how these scripts will impact your site performance. For example, chat widgets can add up to a second of CPU time to your page – effectively freezing your site for a second and hurting your First Input Delay metric.
Third-party code can also delay the initial render of your page. To make sure scripts aren’t render-blocking, place them at the bottom of your page HTML, or check if they have an async attribute.
Content shifts
Some parts of a page will always load faster than others. The text of an article might be included in the initial server response, but images will need to be loaded separately. If content on the page moves around once the image is loaded this will hurt your Cumulative Layout Shift metric.
A common example are leaderboard ads at the top of a page. To load them, browsers need to connect to a server hosted by the ad network, so it might take an extra second or two for the ad to show up. If your user started reading your article they might lose track of where they were, and if they tried to click the play button on a video they might accidentally click on something else instead.
The solution is to provide a placeholder at the same size as the ad. That way when the additional content is loading the overall layout of the page does not change.
Conclusion
Poor site performance can hurt your rankings – check Google Search Console to see if there are any problems on your site.
Run a test in PageSpeed Insights after making changes to your site, to catch issues before they affect search results and the experience of your visitors.
Update: Google have announced Core Web Vitals will become a search ranking factor in 2021.
Glossary
Terms used in this article:
